M17.L01 — The Edgeworth Box and Endowments
Module: Module 17 — Exchange Economy and General Equilibrium Lesson: L01 of 05 Duration: ~30 minutes Level: Intermediate Provenance: Intermediate Microeconomics with Excel (Barreto) | Principles of Microeconomics (Curtis and Irvine)
Learning Objective
Key Diagram
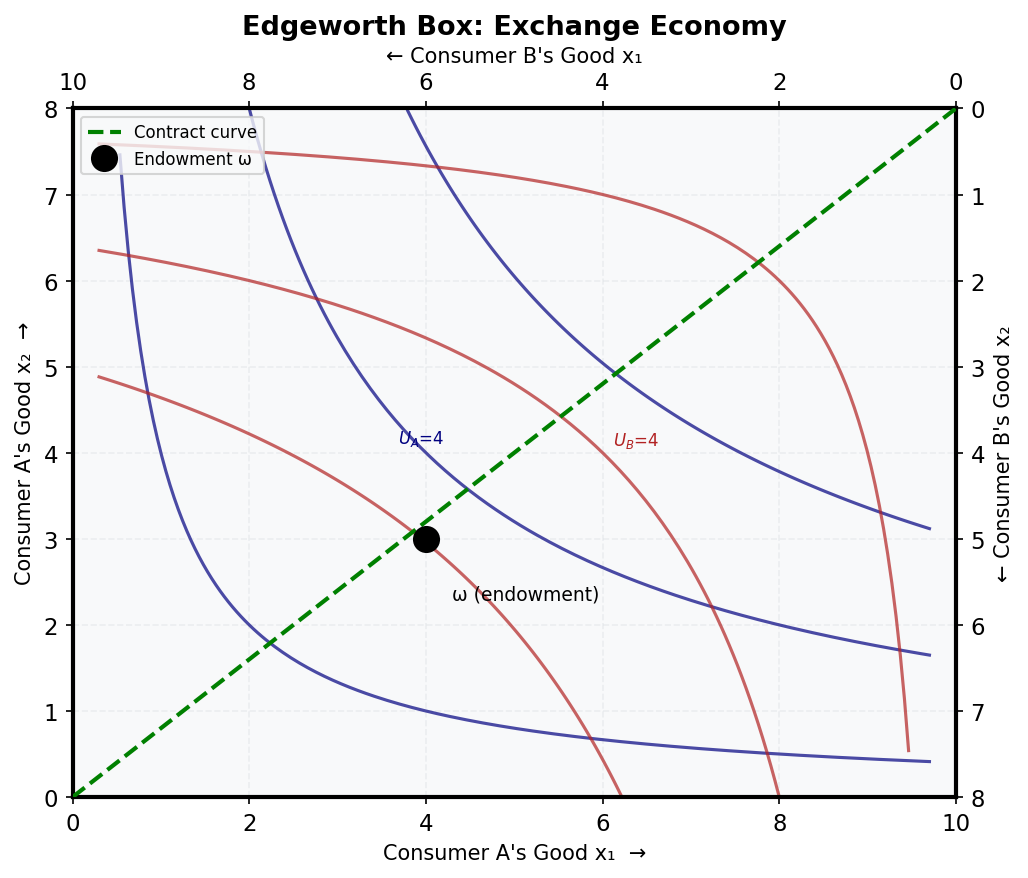
Figure 11: The Edgeworth Box. Consumer A reads from the bottom-left; Consumer B reads from the top-right. The green dashed line is the contract curve of Pareto-efficient allocations.
Construct and interpret the Edgeworth box diagram for a two-consumer, two-good exchange economy.
The Edgeworth Box Framework
The Edgeworth box is a graphical representation of an exchange economy with two consumers (A and B) and two goods (X and Y). The box's dimensions represent the total quantities of goods X (width) and Y (height) in the economy. Any point in the box represents an allocation where:
- Consumer A gets (x_A, y_A)
- Consumer B gets (x_B, y_B) = (X_total - x_A, Y_total - y_A)
The endowment point (ω₁, ω₂) shows the initial allocation before any trade occurs. For example, in an Australian context, consider two households:
- Household A starts with 80% of food but only 20% of clothing
- Household B has the remaining 20% of food and 80% of clothing
Mathematically, if total endowments are X̄ and Ȳ, then:
x_A + x_B = X̄ y_A + y_B = Ȳ
Worked Example
[Australian context]
Consider two Australian farmers trading water rights (X) and livestock (Y), with total endowments X̄ = 1000 ML, Ȳ = 500 head. Farmer A starts with ω_A = (800 ML, 100 head), Farmer B with ω_B = (200 ML, 400 head).
- Draw the Edgeworth box (1000 units wide, 500 tall)
- Plot ω at (800,100)
- Show indifference curves (Cobb-Douglas utility: U_A = x_A^0.6 y_A^0.4)
- The lens-shaped area between the indifference curves represents mutually beneficial trades
Common Misconception
"The endowment point must be at the center of the box"
Correction: The endowment can be anywhere in the box; its position reflects initial inequality in resource distribution, like Australia's uneven water allocations.
Key Takeaways
- The Edgeworth box visually represents all possible allocations in a two-good, two-consumer economy
- The endowment point shows initial resource distribution before trade
- The lens-shaped area between indifference curves shows potential Pareto improvements
- Australian examples include water rights trading and emissions permit markets
Practice
- Given U_A = x_A y_A and U_B = x_B y_B with ω_A = (4,1), ω_B = (1,4), find the contract curve equation
- Draw the Edgeworth box for two Australian states trading renewable energy credits (X) and fossil fuel permits (Y)
- Calculate MRS for both consumers at the endowment point in Q1
Further Resources
Provenance: MIT OCW 14.01 | University of Utah