M12.L03 — Trade Barriers: Tariffs, Quotas, and Their Effects
Module: Module 12 — International Trade and Synthesis
Lesson: L03 of 05
Duration: ~30 minutes
Level: Introductory
Provenance: OpenStax Principles of Microeconomics 3e | MIT OCW 14.01 Principles of Microeconomics
Learning Objective
Key Diagram
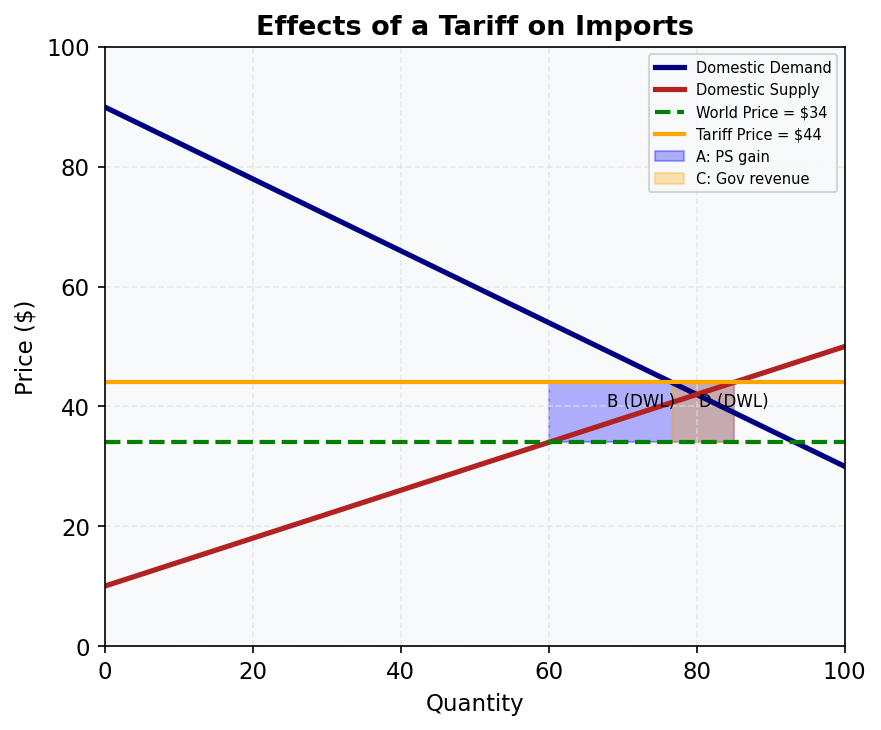
Figure 8: Tariff Effects. Areas A (blue) = producer surplus gain; C (orange) = government revenue; B and D = deadweight loss borne by society.
Calculate the welfare effects of a tariff on consumers, producers, government, and total surplus.
Tariffs: A Tax on Imports
A tariff is a tax levied on imported goods. When a government imposes a tariff of $T per unit:
- The domestic price rises from the world price P_W to P_W + T
- Domestic quantity supplied rises (domestic producers expand)
- Domestic quantity demanded falls (consumers face higher prices)
- Imports = Q_D − Q_S fall
Welfare effects: - Consumer surplus falls (area A + B + C + D) - Producer surplus rises (area A) - Government revenue rises (area C = tariff × imports) - Deadweight loss = areas B + D (triangles representing efficiency loss)
Net welfare effect: consumers lose more than producers + government gain → net loss = DWL (areas B + D).
Quotas
A quota limits the quantity of imports directly. Effects on domestic price, output, and consumption are similar to a tariff — but the revenue rectangle (area C) goes to quota licence holders (often importers), not the government. This makes quotas generally less efficient than equivalent tariffs from a national welfare perspective.
Voluntary Export Restraints (VERs): An agreement where a foreign country limits its own exports. The revenue equivalent goes to foreign exporters — even worse for the importing country's welfare.
Australia's Tariff History
Australia historically protected manufacturing through high tariffs (25–35% in the 1960s–70s). Progressive tariff reductions from the 1980s under the Hawke–Keating governments exposed Australian manufacturers to international competition. The car industry's tariffs fell from 57.5% (1988) to 5% (2010). Most Australian tariffs are now 0–5%, with the standard rate at 5%.
Worked Example
Tariff on imported steel in Australia
World price P_W = $600/tonne. Tariff = $150/tonne → domestic price = $750.
At $600: Q_S = 2m tonnes, Q_D = 8m tonnes → imports = 6m tonnes
At $750: Q_S = 3.5m tonnes, Q_D = 6.5m tonnes → imports = 3m tonnes
- Consumer surplus loss: large area (consumers pay $150 more on all 6.5m tonnes purchased)
- Producer surplus gain: domestic producers gain on 3.5m tonnes
- Government revenue: $150 × 3m = $450m
- Deadweight loss: two triangles from reduced imports and distorted production
Net effect: Australians as a whole lose; steel producers and government gain at consumers' expense.
Common Misconception
"Tariffs protect jobs and are good for the economy."
Tariffs protect jobs in the protected industry but destroy jobs elsewhere — consumers spend less on other goods (due to higher import prices), and export industries lose competitiveness as trading partners retaliate. The net employment effect is typically zero or negative; the real effect is a redistribution from consumers to protected producers.
Key Takeaways
- Tariffs raise domestic prices, reduce imports, generate government revenue, and create deadweight loss
- Quotas have similar price/quantity effects but transfer revenue to quota holders, not government
- Australia dramatically reduced tariffs from the 1980s onwards; most goods now face 0–5%
- Net welfare effect of tariffs is negative — losses to consumers exceed gains to producers and government
Practice
- Draw a supply-demand diagram for an imported good. Mark the world price, the tariff-inclusive price, and label areas A, B, C, D. Identify what each area represents.
- If Australia imposes a $20/tonne tariff on imported sugar: domestic production rises from 3m to 4m tonnes, consumption falls from 9m to 7m tonnes. Calculate government tariff revenue.
- Why is a quota generally considered less efficient than a tariff that achieves the same import reduction?
Further Resources
- 📺 Tariffs and Quotas (Khan Academy) — welfare analysis of trade barriers
- 📺 University of Utah — Trade Policy — principles of trade policy
- 📚 OpenStax Microeconomics — Trade Policy
Provenance: OpenStax Principles of Microeconomics 3e | MIT OCW 14.01 Principles of Microeconomics