Lesson M07.L01: The AD-AS Framework: Overview and Purpose
Module: Aggregate Demand and Aggregate Supply; Macroeconomic Policy Level: intro Duration: 30 minutes Learning Objective: Explain the purpose of the AD-AS model as a framework for analysing macroeconomic equilibrium. Data as of: 2023 Provenance: OpenStax Macro 3e | Khan Academy Macro
Explanation
Key Diagram
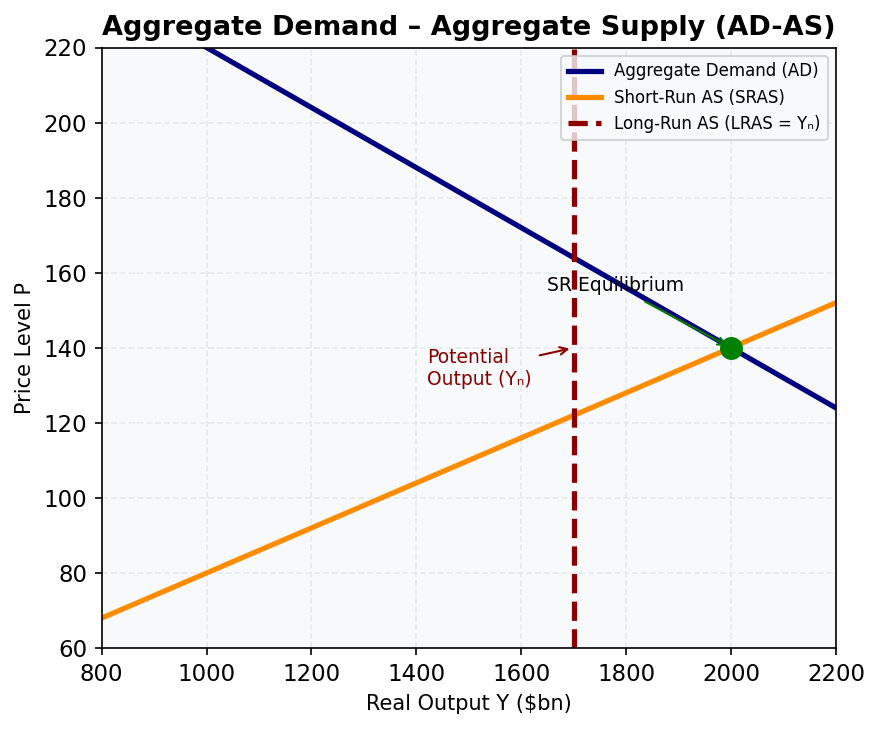
Figure 4: The AD-AS Model. Downward-sloping AD meets upward-sloping SRAS at the short-run equilibrium; vertical LRAS marks potential output.
The AD-AS model (Aggregate Demand–Aggregate Supply model) is the central tool macroeconomists use to understand why an economy's total output and overall price level change over time. Think of it as a supply-and-demand diagram, but for the whole economy at once rather than for a single product.
Aggregate Demand (AD) represents the total spending on goods and services in the economy at each possible price level. It includes consumption by households, investment by businesses, government spending, and net exports (exports minus imports).
Aggregate Supply (AS) represents the total quantity of goods and services that producers are willing and able to supply at each price level. Economists split this into two versions: Short-Run Aggregate Supply (SRAS), which holds some prices fixed, and Long-Run Aggregate Supply (LRAS), where all prices — including wages — have fully adjusted.
Where AD and AS intersect is called macroeconomic equilibrium: the point at which the price level and output are consistent with both what buyers want to purchase and what sellers want to produce.
The AD-AS model helps explain recessions, booms, inflation, and unemployment. In Australia, the Reserve Bank of Australia (RBA) and the federal government use their understanding of this framework to design monetary and fiscal policy responses. For example, when the COVID-19 pandemic hit in 2020, the RBA cut the cash rate to 0.10% and the federal government launched JobKeeper — both actions aimed at shifting the AD curve to the right.
Worked Example
Suppose Australia's economy is initially in equilibrium at a real GDP of $2,000 billion (roughly Australia's 2022 GDP in AUD) and a price level index of 100.
A sudden fall in consumer confidence reduces household consumption by $80 billion.
Step 1: Identify which curve shifts.
Consumption (C) is a component of AD. A fall in C shifts AD left.
Step 2: Quantify the new equilibrium (simplified, ignoring the multiplier for now).
New AD implies a lower level of spending at every price level. In the short run, with sticky wages, output falls.
Approximate new GDP = $2,000b − \(80b = **\)1,920 billion**
Step 3: Interpret.
Output has fallen below potential output (Y). The economy is in a recessionary gap*. The price level also tends to fall slightly in the short run as demand drops.
Step 4: Policy implication.
The RBA could lower the cash rate or the government could increase spending to push AD back toward $2,000b.
Common Misconception
Misconception: The AD-AS model is the same as a regular supply-and-demand diagram for a single market.
Correction: In a regular supply-and-demand diagram, the axes are price and quantity for one good. In the AD-AS model, the vertical axis is the overall price level (e.g., the CPI) and the horizontal axis is real GDP — total output across the entire economy. The reasons the curves slope the way they do are also completely different (e.g., the AD curve slopes down for macro reasons unrelated to substitution effects between goods).
Practice Prompts
-
What does the intersection of the AD and AS curves represent? → Answer: It represents macroeconomic equilibrium — the price level and level of real GDP at which total spending in the economy equals total production.
-
Name the four components of Aggregate Demand. → Answer: Consumption (C), Investment (I), Government spending (G), and Net Exports (NX = Exports − Imports).
-
Why do economists distinguish between Short-Run and Long-Run Aggregate Supply? → Answer: In the short run, wages and some prices are "sticky" (slow to adjust), so output can deviate from potential. In the long run, all prices adjust fully, and output returns to its potential level (Y*), making LRAS vertical.
Further Resources
- 📺 Macro Unit 3 Summary - Aggregate Demand/Supply and Fiscal Policy — ACDC Economics (15 min)
- 📺 Macroeconomics: Crash Course Economics #5 — Crash Course (12 min)
- 📚 RBA — Monetary Policy Explainer — How the RBA uses AD-AS thinking to set the cash rate